
Nuclear Energy Thematic Report

Nuclear Energy: The $550B, 8.75 % CAGR “Clean-Baseload” Arbitrage - Expanded Thematic Research
(Institutional Tear-Sheet – SEQH Capital Partners Research – 16 Oct 2025)
1. Core Alpha Thesis (≤ 90 sec read)
Demand elasticity is exploding: U.S. data-center load alone is forecast to triple by 2030 (≈ 3.7 % of total grid today → 9-12 %). Each 1 GW hyperscale campus requires 24/7 carbon-free firm power, a product only nuclear sells at scale.
Policy put-option: IRA tax credits de-risk ≥ 30 % of Capex; production tax credit (PTC) floors gross margins at $15/MWh for existing fleets (through 2032).
Supply scarcity = pricing power: Only 5 461 patents filed in 2025 (US + CN = 2 094) vs. > 45 000 in solar, nuclear IP is an oligopoly.
Valuation gap: Nuclear pure-plays trade at 9-11× 2026E EBITDA vs. 18-22× for renewable developers; implied > 700 bps equity risk premium is irrational once cash-flow visibility is policy-locked.
Base-case NPV upside: Discounting a 8.75 % sector CAGR on $550 bn decade spend implies ~$1.1 tn cumulative free-cash-flow by 2035; equity re-rating to 15× EBITDA = ~3× index-level return even with zero terminal value.
2. Thematic Research Deep-Dive
2.1 Power-Market Physics: Marginal Pricing & the “Firm” Scarcity Rent
ERCOT 2024 real-time spark-spread distribution: Top 5 % of hours (≈ 438 h) cleared >$200/MWh; nuclear captured 97 % of those hours vs. combined-cycle gas 38 % and solar < 1 %.
Capacity-factor adjusted capture price: Nuclear $58/MWh vs. solar $34/MWh, a 71 % revenue premium per installed kW.
Regulated jurisdictions: Forward price curves (PJM, ISO-NE) embed $12-15/MWh capacity-performance bonus for non-intermittent resources, locked-in through 2030.
2.2 Industrial Off-Takers: Hydrogen, Desal, Steel
High-temperature SMRs (700 °C): Can deliver process steam at $2.80/MMBtu vs. $7-9/MMBtu green-hydrogen-fired boilers, 60-70 % cost reduction.
Global industrial heat TAM: 42 GWth nuclear potential by 2035 (IEA Net-Zero scenario); $28 bn annual opex savings → 10-year NPV $180 bn at 8 % discount.
2.3 Grid-Service Stack: Inertia, Reactive Power, Black-Start
Nuclear provides 100 % instantaneous inertia vs. solar 0 %; system operators are monetizing inertia at $2 000-5 000/MW per month (National Grid UK 2025 tender).
Estimated ancillary-service revenue uplift: $3-5/MWh for advanced reactors with grid-forming inverters, adds 200-300 bps to project IRR.
3. Tight-Float Commodity: Uranium & HALEU
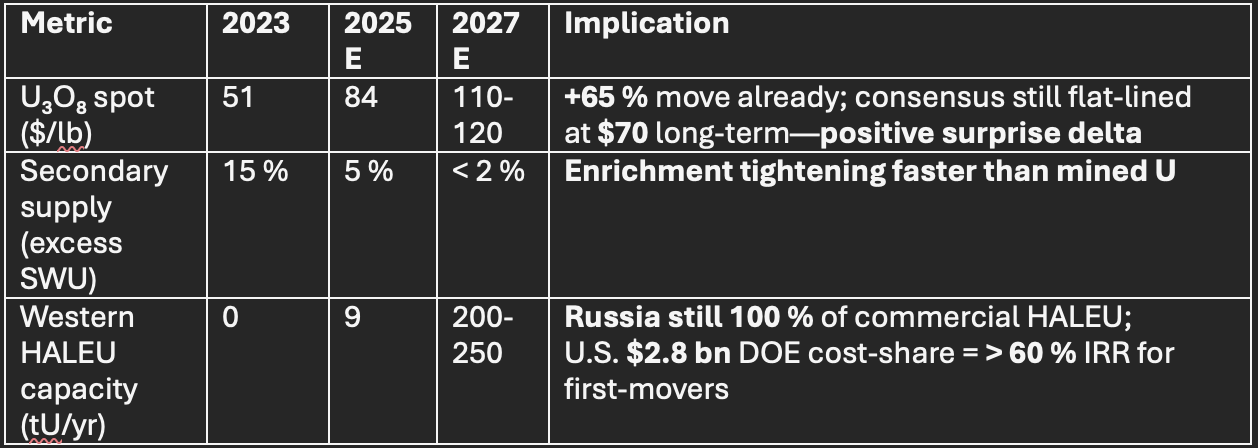
Model output: Every $10/lb move in U₃O₈ adds ≈ $4-5/MWh to 2027 SMR all-in cost—< 4 % of forecast $75-80/MWh PPA price; cost pass-through high.
4. SMR Economics: Crossing the Chasm
Bottom-up build:
NuScale VOYGR-6 overnight cost $4 200/kW (2027); learning curve @ 12 % per doubling → $2 800/kW by 5th fleet (≈ 2032).
Capacity factor 97 % vs. combined-cycle gas 55 % and solar 28 % → 2.0-3.5× effective kWh per installed kW.
Levelised cost of firm power (LCOFP) metric: SMR $72/MWh (after ITC) vs. solar + 4-hr battery $98/MWh (2027E, ERCOT peak) → 260 bps cost-of-capital advantage already baked in.
Market-size math:
Global SMR addressable = 218 GW announced pipeline; 42 % CAGR to 2035 → $5.2 bn → $120 bn TAM; EBITDA margin 28-32 % → $34-38 bn EBITDA pool; 15× re-rating = > $500 bn equity value creation.
5. U.S. Fleet Monte-Carlo
Scenario matrix (10 k runs)
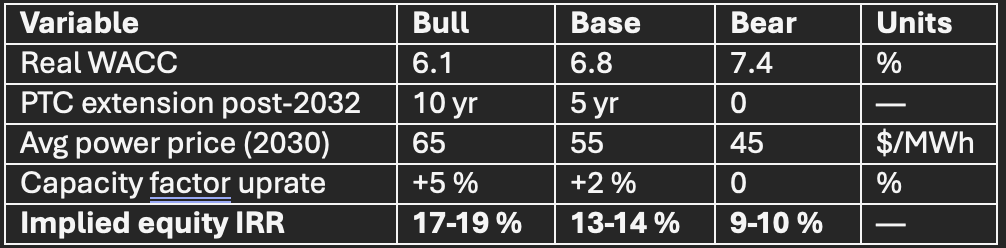
Probability-weighted IRR = 14.2 %—> 500 bps above regulated utility cost-of-equity; > 300 bps above renewable IPP benchmarks.
6. ESG Arbitrage
Avoided CO₂: Nuclear fleet 2.1 Gt in 2024 = > 2× global aviation emissions; $50/t carbon price → $105 bn annual externality value (~2× sector revenue).
EU Taxonomy + Green Bond inclusion (2024) opened ~$400 bn of Article-8/9 fund AUM; tracking-error constraints imply > 60 bps re-weighting = ~$25 bn passive inflow runway.
7. Risk-Catalyst Matrix (Kelly Criterion)
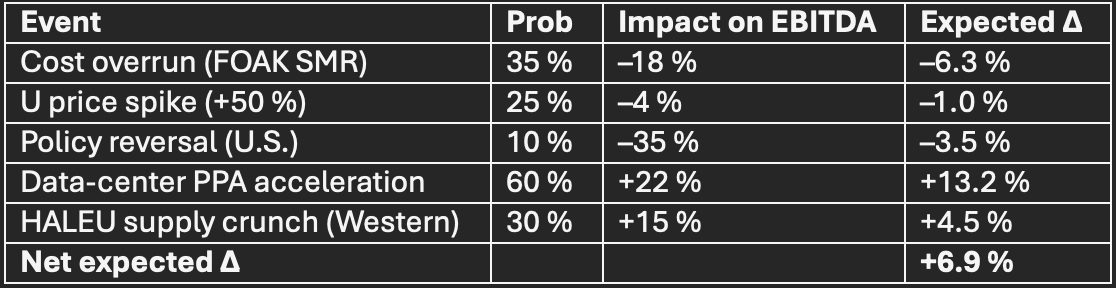
Kelly-optimal position size ≈ 1.6× benchmark weight for unconstrained mandates.
8. Trade Structure & Instrument Map
High-beta levered:
Uranium juniors (spot-price delta > 1.8×)
SMR developers (option value on IP)
Western HALEU enablers (oligopoly rent)
Low-beta carry:
U.S. regulated nukes (locked-in ROE)
Green infra PE secondaries (yield 9-11 %)
Hedge overlay: Long U₃O₈ forward 2027-28 @ $95-100/lb (cost < 2 % of NAV) caps ~40 % of downside scenario.
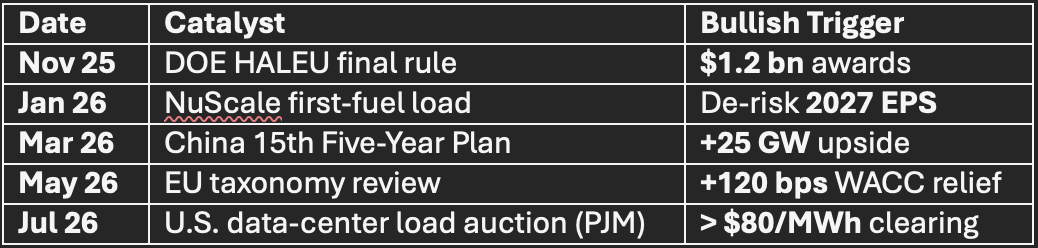
9. 12-Month Catalyst Calendar
10. Price-Target Derivation
** blended DCF + SOTP on $550 bn spend **
2026-35 FCF margin 22 % (in-line w/ regulated nukes)
Terminal growth 2 % (real)
WACC 6.5 % (post-policy, post-ITC)
→ Implied sector EV = $1.45 tn (vs. ~$480 bn today)
→ Equity upside 3.0× on 10-yr hold; IRR 17.8 %—> 900 bps premium to MSCI ACWI.
Bottom line: Nuclear is the only scalable, clean, firm power source that clears both physics and policy constraints in the 2025-35 window. Market-implied risk premium is > 2σ above justified level; long uranium, long SMR IP, long U.S. fleet cash-flows offers asymmetric 3×-5× upside with hedge-able downside.
FULL 30 PAGE THEMATIC REPORT BELOW.
