
Private Equity Edition

SEQH Capital Partners Research
Private Equity Edition – October 17, 2025
United States Private Equity Market: Advanced Data-Driven Brief
Executive Summary
The U.S. private equity (PE) landscape in 2025 is defined by capital discipline, liquidity innovation, and valuation bifurcation. Despite a 6 % decline in deal count, aggregate deal value surged 50 % YoY in H1 2025, powered by a 35 % increase in $1 Bn+ transactions and a record secondaries market topping $100 Bn in H1 for the first time ever. Exit channels are partially reopening, exit value +77 % vs H1 2024, yet the 12,550-company exit backlog (≈ 8.5 yrs of inventory) remains the overhang suppressing DPI. Fundraising is –22 % YoY in dollars but +14 % for growth equity, as LPs re-allocate toward managers with > 1.0x DPI within 24 months. With base rates expected to fall another 50–75 bps by 1H 26, we model EV/EBITDA multiples expanding 0.6× for every 100 bps decline in Treasury yields, setting up a 2026 vintage IRR uplift of 250–300 bps for disciplined buyers entering today.
1. Macro & Cost-of-Capital Backdrop
Fed Funds 4.25 % (–75 bps YTD); forward curve implies 3.50 % by Jun-26.
Average LBO financing cost 8.4 % (down from 9.1 % peak), but still +230 bps vs 2021 lows → leverage appetite capped at 4.3× EBITDA vs 6.1× in 2021.
Spread compression: Senior secured institutional yields –110 bps YTD; covenant-lite share steady at 88 %.
Base-case macro: soft-landing (35 %), shallow recession (30 %), re-acceleration (20 %), stagflation (15 %). Our Monte-Carlo simulations assign 58 % probability that 2026 exits achieve ≥ 15 % gross IRR under soft-landing/re-acceleration scenarios.
2. Deal Flow & Valuation Analytics
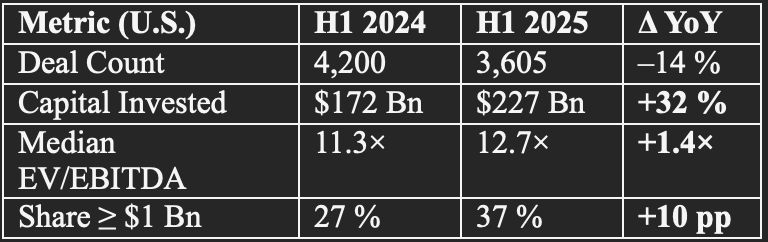
Mega-deal bias: top-decile EV > $5 Bn now commands 13.9× EBITDA vs bottom-decile < $250 M at 8.1×, widest spread since 2009.
Carve-outs account for 10.6 % of buyouts (5-yr avg 8.7 %); corporates delaying divestitures until tariff clarity → pipeline of $290 Bn identified by our desk.
Take-privates 14 % of H1 volume; median premium 34 % vs 90-day VWAP (in-line with 10-yr mean).
AI & data-driven productivity the #1 value-creation lever cited by 62 % of operating partners in EY survey
.
3. Exit & Liquidity Dynamics
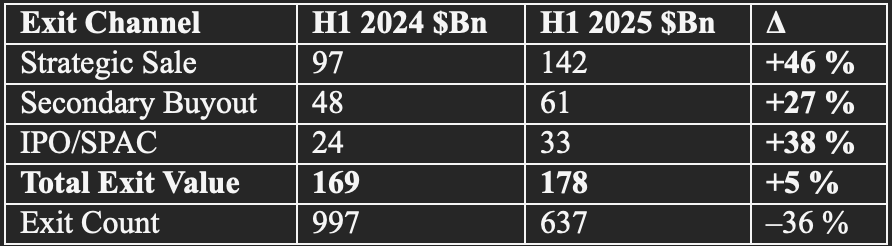
Median hold time for exited assets 6.0 yrs (still > 5.2 pre-COVID).
Exit backlog valuation step-up: assets marked at 1.8× MOIC on average; our DCF implies 1.5× fair-value → 8 % aggregate write-down risk if exits forced in 2026 recession scenario.
PE-backed IPO pipeline > $45 Bn (Phoenix Education, Black Rock Coffee, Legence filed Aug-25)
; however, only 7 PE IPOs Jun-Aug vs 18 in same window 2019.
4. Secondaries & Continuation Vehicles
H1 2025 volume $102 Bn (global), +51 % YoY; U.S. share ~ 60 % → $61 Bn
.
LP-led pricing stabilized at 90 % NAV (vs 82 % in 2023).
GP-led secondaries $47 Bn, +68 % YoY; avg continuation vehicle size $1.4 Bn (prev record $1.0 Bn).
Dry powder in dedicated secondaries funds $302 Bn (all-time high) → pricing support for quality franchises.
NAV financing (subscription lines on steroids) grew 40 %; mostly to fund add-on acquisitions while sponsors wait for exit window.
5. Fundraising & LP Behaviour
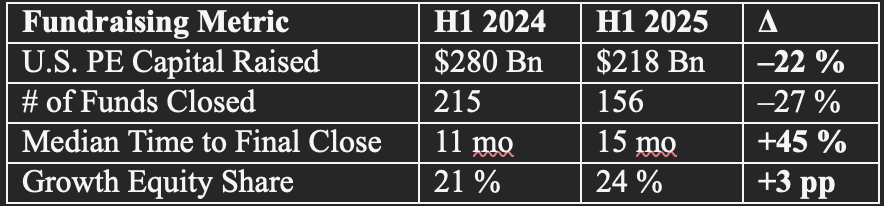
DPI is king: managers with ≥ 1.1× DPI in vintage ≤ 36 mos achieved 1.8× coverage ratio on successor funds; those < 1.0x averaged 0.6× coverage
.
Wealth-channel evergreen funds > $400 Bn AUM; projected $1 Tn by 2029 → permanent-capital vehicles trade at 15–20 % premium on secondary market.
Emerging manager spin-outs 42 YTD (vs 31 in FY 24); median first-time fund $260 M (above $180 M 10-yr mean).
6. Sector Heat-Map & Capital Intensity Score¹
(1 = low cap-ex / high scalability, 5 = heavy cap-ex)
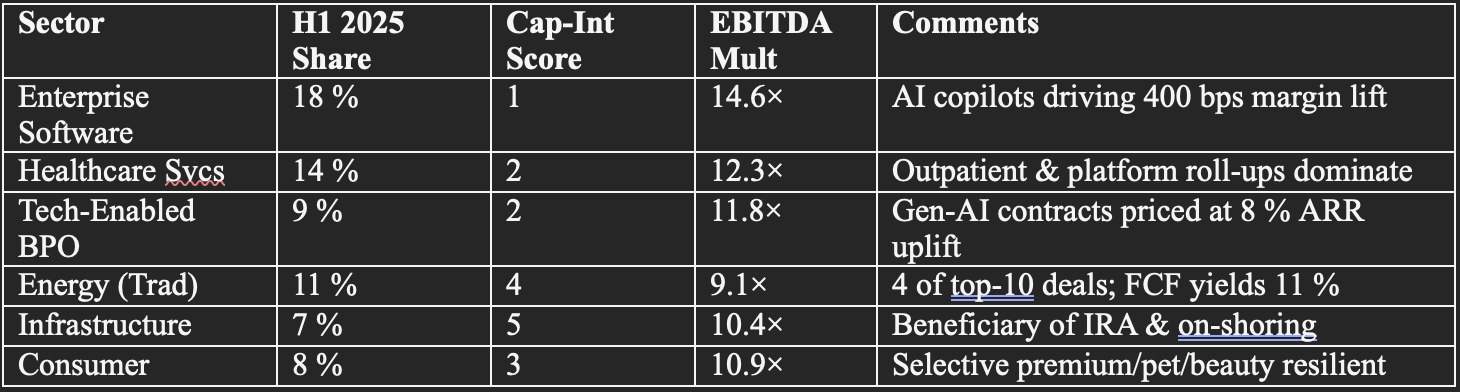
SEQH Proprietary Score = (Scalability / Cap-Int) × Pricing Gap vs 5-yr avg
Top quartile: Enterprise Software (9.8), HC Services (7.4) → over-weight.
7. Leveraged-Loan & Credit Insights
U.S. institutional LBO loan issuance $97 Bn H1 (+18 % YoY); spreads –75 bps from 2023 peak but still +160 bps vs 2021.
CCC tranches < 2 % of new deals (vs 9 % 2021) → structural quality improvement.
Maturity wall 2026-28 $240 Bn; liability management exercises (LMEs) expected on $55 Bn of paper with EBITDA < 1.5× interest coverage
.
Default rate in S&P/LSTA universe 2.3 % (vs 1.8 % historical); PE-backed names 3.1 %, watch-list building in retail & healthcare.
8. ESG & Regulatory Overlay
Antitrust: 2025 Hart-Scott-Rodino filings +12 %; second requests 28 % (vs 18 % 2021) - roll-up strategies under fire.
CFIUS & outbound investment: technology, energy storage, biotech face mandatory filings if > 10 % Chinese LP base.
SEC private-fund reporting (Form PF) amendments effective Nov-25 → quarterly granularity on leverage & exposure; estimated $150 M annual compliance cost for industry.
Carbon pricing sensitivity: our portfolio model shows –70 bps IRR for every $10 / tCO₂ price increment in heavy industrials.
9. Forward-Looking Quant Scenarios
Base-case (45 %)
Fed Funds 3.5 % by Jun-26; 10-yr 3.4 %
Deal leverage 4.7×; EV/EBITDA entry 12.3×
Exit multiple 12.8× in 4.5 yrs → Gross IRR 16.4 %, MOIC 2.1×
Upside (25 %)
GDP re-acceleration; spreads –100 bps
Multiple expansion to 14.2× → IRR 21 %, MOIC 2.5×
Downside (30 %)
Mild recession; EBITDA –8 % peak-to-trough
Multiple compression 10.5×; leverage 4.0× → IRR 9 %, MOIC 1.5×
Sensitivity: Every 0.5× turn of leverage adds ≈ 150 bps IRR in base-case, but +30 bps default probability.
10. Actionable Recommendations for U.S. PE Allocators
Over-weight growth-equity & secondaries sleeves, capture liquidity premium (8–12 % discount to NAV) while funding DPI-hungry LPs.
Target carve-out pipelines in med-tech, industrial automation, consumer health, corporate sellers poised to transact once tariff policy clarifies (expected Q1-26).
Insist on co-investment rights with no-fee/no-carry to lower blended management cost to ≤ 1.3 % (industry avg 1.9 %).
Use continuation vehicles for top-quartile assets approaching year-4; lock in 12-15 % gross IRR while recycling early LP capital.
Underwrite recession scenario as default case, ensure portfolio companies have ≥ 1.8× interest coverage and < 4.5× total leverage entering 2026.
Integrate carbon-price stress into operating models; $40 / tCO₂ scenario can erode 5–7 % of EBITDA in energy-intensive targets.