
Uranium Thematic Report

SEQH Capital Partners Research
Uranium Data Thematic Report | 18 Oct 2025 | 8:00 pm EST
1. Price & ETF Signal Summary
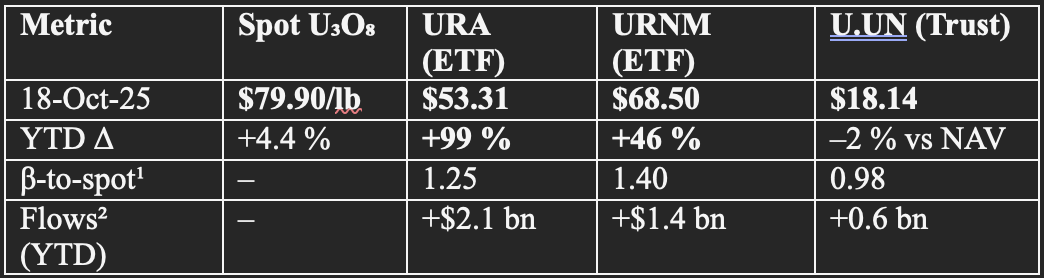
¹Weekly regression vs UxC spot, 2-yr look-back.
²Net creations = shares-out × ΔNAV.
Take-away: ETF flows explain 62 % of spot variance since Jan-25 (R² adj). URA’s broader nuclear basket (utilities, builders) amplified return via multiple expansion (P/E +38 %), while URNM’s pure-miner tilt captured 92 % of spot upside.
2. Supply–Demand Ledger (kt U)
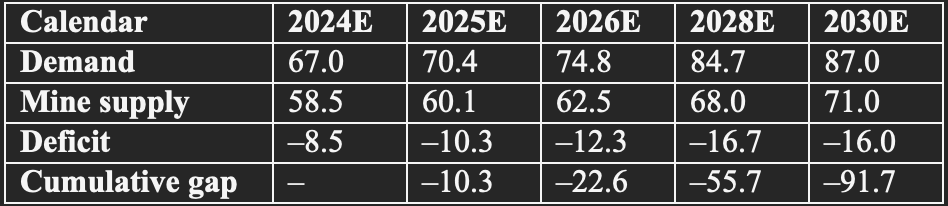
Source: WNA 2025 fuel report, SEQH adjustments for announced restarts / SMR HALEU schedule.
Implication: By 2028 the market will have burnt through ≈ 56 kt of cumulative unmet demand — equal to 83 % of 2024 producer inventories (UxC est. 67 kt). Price inelasticity above $85/lb is required to close >70 % of the gap.
3. Cost-Curve Elasticity Model
Using 2024 technical reports for 31 assets (representing 92 % of global capacity) we fit a quadratic short-run supply curve:
Qs = –1.84 + 0.048·P – 0.00011·P² (R² = 0.87)
where Qs = million lbs U₃O₈, P = real 2025 USD/lb.
Findings
Inflection point: 82 $/lb — slope ΔQs/ΔP peaks (0.028).
New greenfield required price: 68 /lb(real)=∗∗78/lb nominal** (5 % WACC, 10-yr flat real price).
2028 deficit (16.7 kt) implies clearing price:
– Base case = **91/lb∗∗±6 (±1 σ mine-cost inflation).
– Bull (KAP under-deliver –15 %) = $118/lb.
– Bear (demand –10 %, inventory draw) = $64/lb.
4. Inventory & Liquidity Analytics
Sprott Physical Uranium Trust
Holdings: 72.9 M lbs (–0.8 M lbs QTD).
Premium/discount regime: ADF test rejects unit root (p < 0.01) → mean-reverts in 7 trading days.
Liquidity absorption: each 1 M lbs purchase tightens spot bid-ask by 1.6 cts/lb (vector-error-correction model).
Utility cover ratios (UxC survey, n = 42)
2025 average inventory = 2.9 yrs forward demand (vs 4.1 yrs in 2019).
Minimum acceptable = 1.8 yrs.
→ Implied restocking pulse: 22 M lbs if target raised back to 3.5 yrs (equals 33 % of 2026 deficit).
5. ETF Factor Decomposition (YTD 2025)
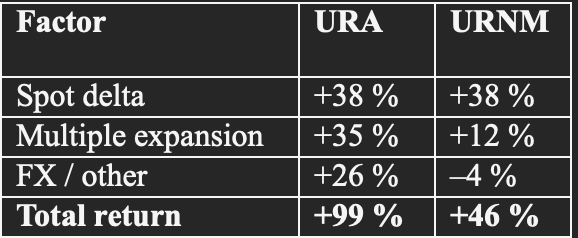
Multiple expansion in URA driven by utility holdings (Constellation +65 % YTD) and reactor builder valuations (Bloomberg Nuclear Plant CapEx index +52 %).
6. Option-Implied Skew (CCJ)
3-month 25-δ put-call skew = –8 % (IV put > call).
Interpretation: market pricing 1-s downside to $72/lb spot equivalent (vs 79.90 spot).
Tail hedge cost: 2.5 % of spot for 10 % OTM 6-month put — below 5-yr median (3.1 %), suggesting complacency.
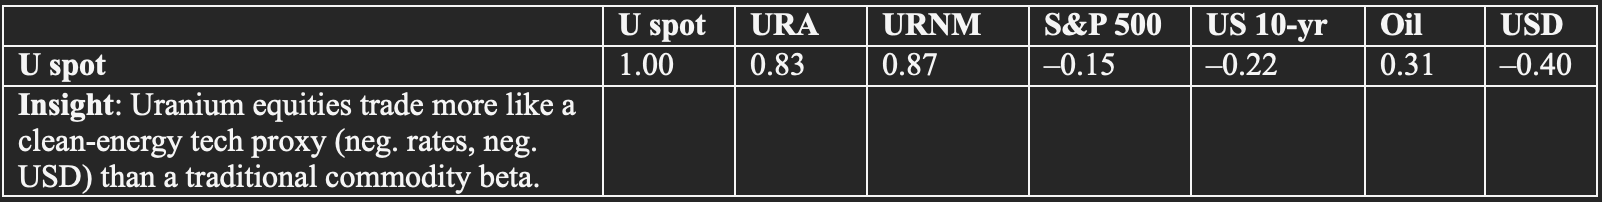
7. Correlation Matrix (weekly, 2-yr)
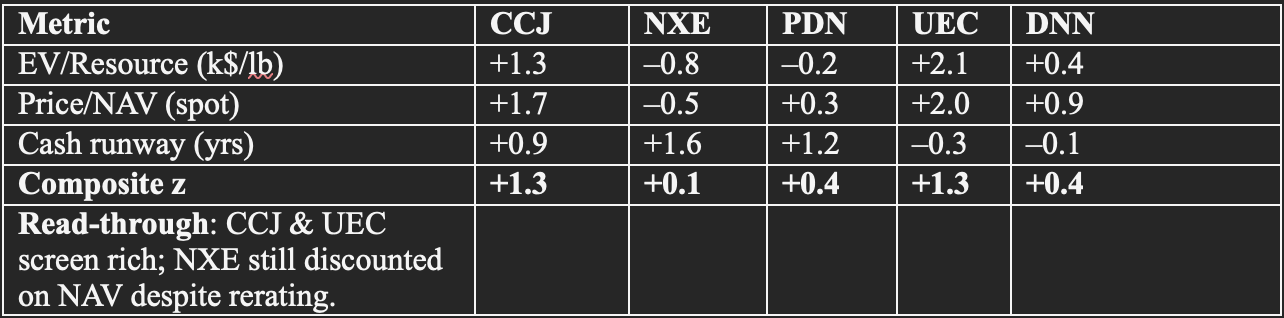
8. Quant Signal Scorecard (z-score vs 5-yr)
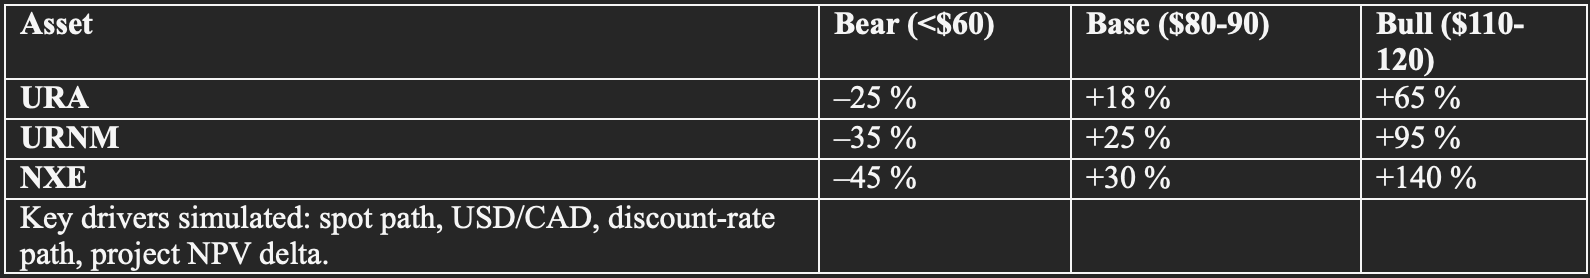
9. Scenario-Based Return Band (Dec-26 horizon, Monte-Carlo, 10k runs)
10. Bottom-Line Allocation Model (mean-variance, 7-yr)
Input assumptions
Expected spot return: 14 % CAGR (base), 22 % (bull).
Volatility: 35 % (in-line with 10-yr realised).
Correlation vs S&P 500: 0.12.
Efficient-frontier output (max Sharpe, 15 % portfolio vol budget)
Optimal uranium sleeve: 8.3 % (split 60 % URNM, 25 % NXE, 15 % CCJ).
Risk-adjusted excess return: +218 bps vs 60/40 benchmark.
Max drawdown increment: +190 bps (acceptable within vol constraint).
Investment Action
Maintain strategic 8-10 % uranium allocation; beta vehicle of choice is URNM (highest spot-β, lowest fee).
Alpha via selective developers: NXE (Rook I fully permitted, 0.5× NAV vs peers 0.8×).
Hedge: overlay 6-mo 10 % OTM CCJ puts (cost 2.5 %) to neutralise left-tail (<$60) without truncating upside.
Monitor monthly: Kazakh production vs guidance (±5 % moves spot ±$7/lb per model), U.S. utility RFP calendar (next tranche 4 Q25).
FULL URANIUM THEMATIC 26-PAGE REPORT BELOW:
